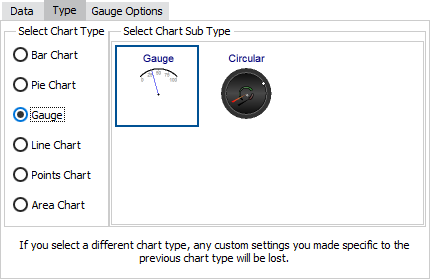
Chart Wizard - Gauge Properties
Gauge charts are useful for showing metrics in relation to a goal.
After you have selected a gauge from the list of chart types on the Type tab, you can then select a chart sub-type and configure various chart options.
Gauge Chart Sub-Types
Classic charts give you the option of a regular Gauge chart or a Circulargauge. The Gauge sub-type displays the data in an arc, whereas the Circular sub-type uses a full 360° circle.
Standard charts support only the Gauge sub-type.

![]()
Multiple Series with Gauges
Classic charts allow you to construct a gauge with more than one needle, or to overlay a gauge on another chart type, when you have more than one series in a chart.
When using standard charts, you will need to create a separate chart for each series that uses the gauge type. You can then position each chart wherever you choose in relation to the other chart(s). Standard charts do not support gauges with multiple needles.
Gauge Options
Classic charts provide an additional configuration option for gauges via the Gauge Options tab:

- Circled - When checked, the gauge will be a regular arc or circle. When unchecked, the arc or circle will stretch to fit the available space.
Standard charts do not have any configurable options for gauges.
See also: Configuring Series Labels